Singapore's producer price index has jumped 9 percent from a year earlier in December, pushed by a 47.3 percent surge in the oil index, Department of Statistics Singapore said on Friday (Jan 27), pointing to increasing inflationary pressures in the island economy.
It followed a 0.4 percent rise in November and came as the fastest since November 2011. The PPI inflation had fallen below zero in early 2014 and stayed in the negative zone throughout 2015 and most of 2016.
In a separate statement, Singapore said the import and export price index too rose more than expected in December.
Import prices rose 8.8 percent year-on-year in December with the index jumping to 84.40 from November's 80.90, making it to its highest since mid-2015.
Export prices meanwhile accelerated 3.3 percent rebounding from a 1.2 percent decline in November, helped by the index rising to 88.40 from 85.10.
Singapore consumer price inflation has surged to a 27-month high of 0.2 percent in December reversing a deflation streak since late 2014.
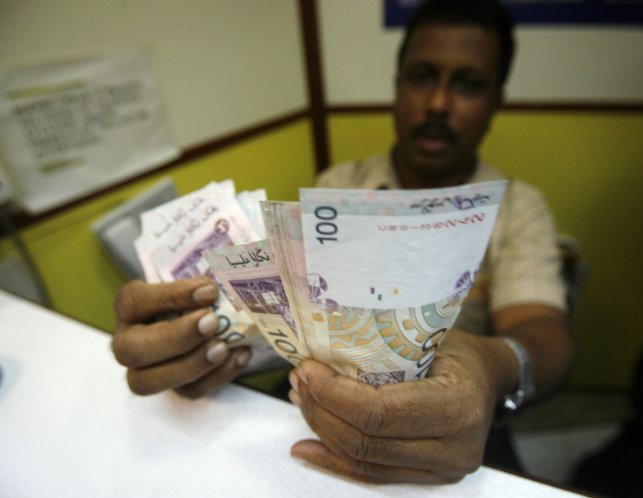
The Singapore dollar slipped against the broadly strong US dollar on Friday while the across-the-globe bullish stock sentiment helped the STI index end higher on the day.
Moving off an over two-month high of 1.4110 hit during the week, the Singapore dollar traded 0.24 percent weaker at 1.4285 from its last Friday's close as at 5:10pm local time.
Medium-term downtrend
However, technically, the rally in the Singapore dollar against its US counterpart this year doesn't seem to have ended in a near-term perspective, but the medium-term downtrend in the local dollar began two years ago is intact, charts show.
The USD/SGD pair had moved off the 7-year high of 1.4538 hit last month, translating to a 2% gain in the Singapore currency since then, but charts show several support levels for the pair before breaking the broad upward journey since mid-2014.
A break below the current support of the pair near 1.4150 can take it to 1.3950 (50% fibonacci break of the 6-month upward move of the pair to its December peak) without much struggle, but there is a stronger support near 1.3800 (38.2%), which comes in line with the 100-period moving average on a weekly chart.
The next important level on the downside of the pair is 1.3600 (23.6%), which also comes on the trend line, ahead of a retest of the June 2016 trough of 1.3312, which was a 1-year high for the Singdollar then.


