The sun is getting dimmer with every passing day and it's getting consecutively more blank as well because of lacking sunspots. In 2017 alone, 96 days have so far been observed without sunspots, according to NASA's Spaceweather.

SpaceX, the company owned by Elon Musk, launched TSIS-1, a brand new sensor, to the ISS (International Space Station) on December 15. The sensor, which would be replacing the old SORCE spacecraft, is supposed to assess how much and how quickly the sun is losing its irradiance. The sensor will study the sun for five-years. According to NASA Solar Dynamics Observatory, the total solar irradiance (TSI) has taken a plunge as the sunspot cycle declined the most this year in the last 11 years.
The sun's productivity has declined about 0.1% throughout the whole electromagnetic spectrum in comparison with the 2012-2014's Solar Maximum. An alteration of 0.1% may sound like a bare minimum; however, it's huge in terms of the energy that the sun dumps on earth. A variation of as minimum as 0.1% is capable of surpassing all the other energy sources of our home planet.
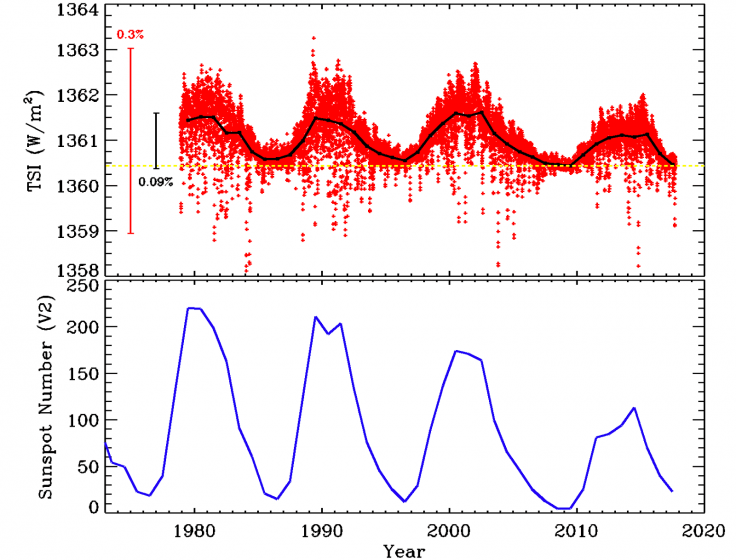
NASA Solar Dynamics Observatory (SDO) Mission Blog has recently published a chart, which depicts the plunge in TSI since 1978. These changes were observed by nine preceding satellites.

"In the top plot, we drew the daily average of measured points in red (so there are a lot of points, 14187 to be precise). On the left is a red vertical bar showing a 0.3% change in TSI. The black curve is the average of TSI over each year. The dashed horizontal line shows the minimum value of year-averaged TSI data. The vertical black bar shows the 0.09% variation we see in that average. The bottom plot shows the annual sunspot number from the SIDC in Belgium in blue," explained the NASA SDO Mission Blog.
Here are the things that we can learn from this chart:
- TSI changes on a regular basis and that's why it is not called the solar constant anymore
- TSI increases if the number of sunspots surges and when the sunspot cycle declines so does TSI. "This waxing and waning of TSI with sunspot number is understood as a combination of dark sunspots reducing TSI below the dashed line and long-lived magnetic features increasing TSI. SORCE has even observed flares in TSI," stated the blog.
- The horizontal line in the middle of the two plots is not the average. "It is drawn at the lowest value in the year-averaged TSI data (that happened in 2009). When there are no sunspots the Sun's brightness should be that of the hot, glowing object we always imagined it to be. We would expect TSI to be the same at every solar minimum. There is much discussion over whether the value of TSI at solar minimum is getting smaller with time, but it is not getting larger."
Also Read: Startled NASA scientists reckon oldest, fastest growing supermassive black hole
Thus, the data proves that the sun, contrary to popular belief, is not getting more radiant with time. While it's true that the sun's brightness depends on the sunspot cycle, the solar activity level has been on a decline for the past 35 years. Reportedly, as the above chart goes, we would witness the next deep Solar Minimum during 2019-2020.


